Common retention wisdom is "bigger is better" but what matters is the retention curve's "flatness".
So, I built a tool that ingests retention values (D1, D30, D90, etc) and predicts:
- The full retention curve
- DAUs
- LTV
- and more
The inspiration for this project was a paradox.
I was observing companies with 'good' retention but with more spikier usage than some companies with 'bad' retention with enduring growth. Why?
This led me to the Shifted Beta Geometric (sBG). It's the gold standard for predicting customer churn in subscription businesses. I asked myself if I could adapt it for consumer apps/games and the results were eye-opening.

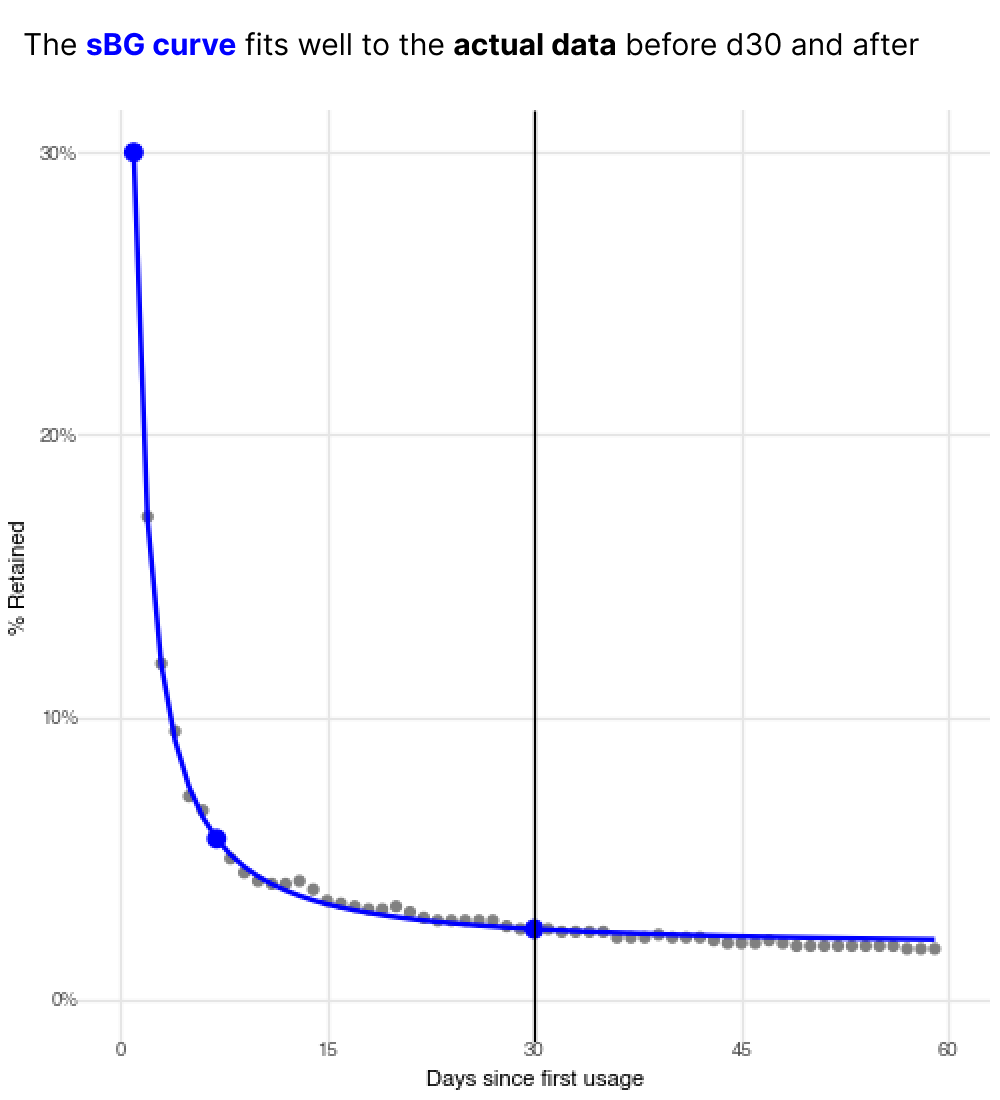
With just a few retention data points (ie D1, D7, D30), the sBG can map a company's entire retention curve with remarkable accuracy.

This lets us do many interesting things, such as quantify retention quality, predict average user tenure, and forecast DAUs and LTV.
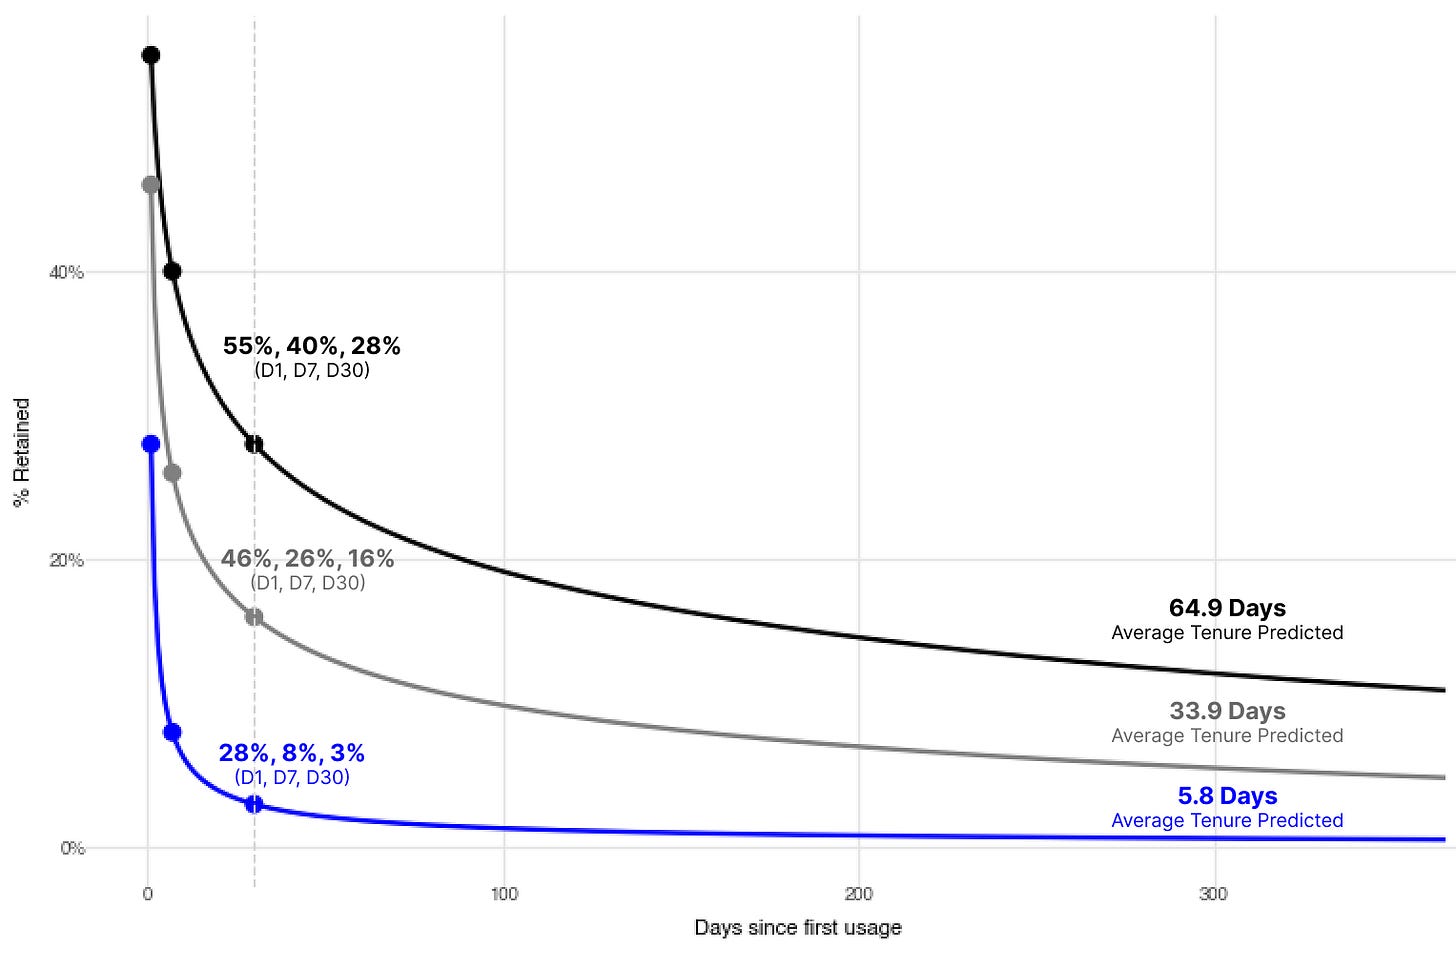
To quantify retention quality, we can calculate area under the retention curve.
This represents the average user's tenure or the average amount of active days a user will have over the course of the observation period (in our case 365 days).
This reveals a key insight - the shape of your retention curve matters more than individual metrics. It's not about Day 1 - it's about Day 365 and beyond.
For example:
- 60%, 30%, 15% retention
can be WORSE than
- 30%, 20%, 13% retention
Because the second curve is flatter
This "flattening retention" is the holy grail. It's why apps like Discord, Roblox, and Fortnite show consistent growth despite not having sky-high early retention numbers.
But retention isn't everything. Growth comes from retention AND acquisition. Revenue comes from retention AND ARPDAU.
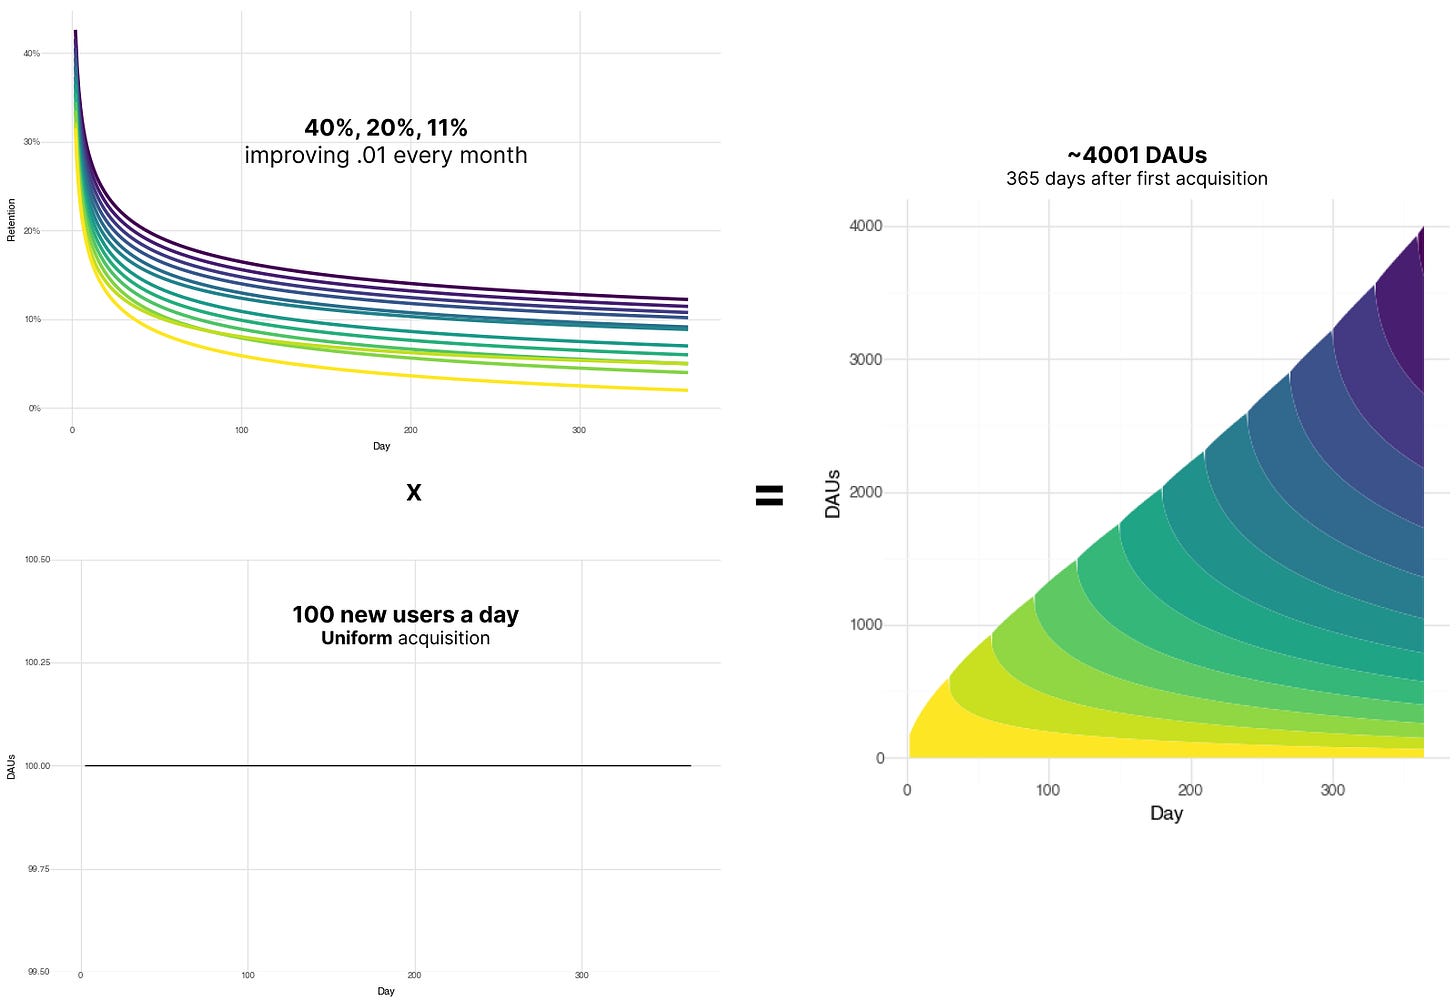
Our model combines both, which allows for solid predictions of DAUs and LTV over time.
For example, we can see how different acquisition + retention curves can map to different DAU curves.
We can also compare/contrast what matters more now: acquisition or retention?
In the long run, a 1% increase in retention is ~2.5x more valuable than a 1% increase in acquisition. Retention compounds!
We can also math out exponential growth.
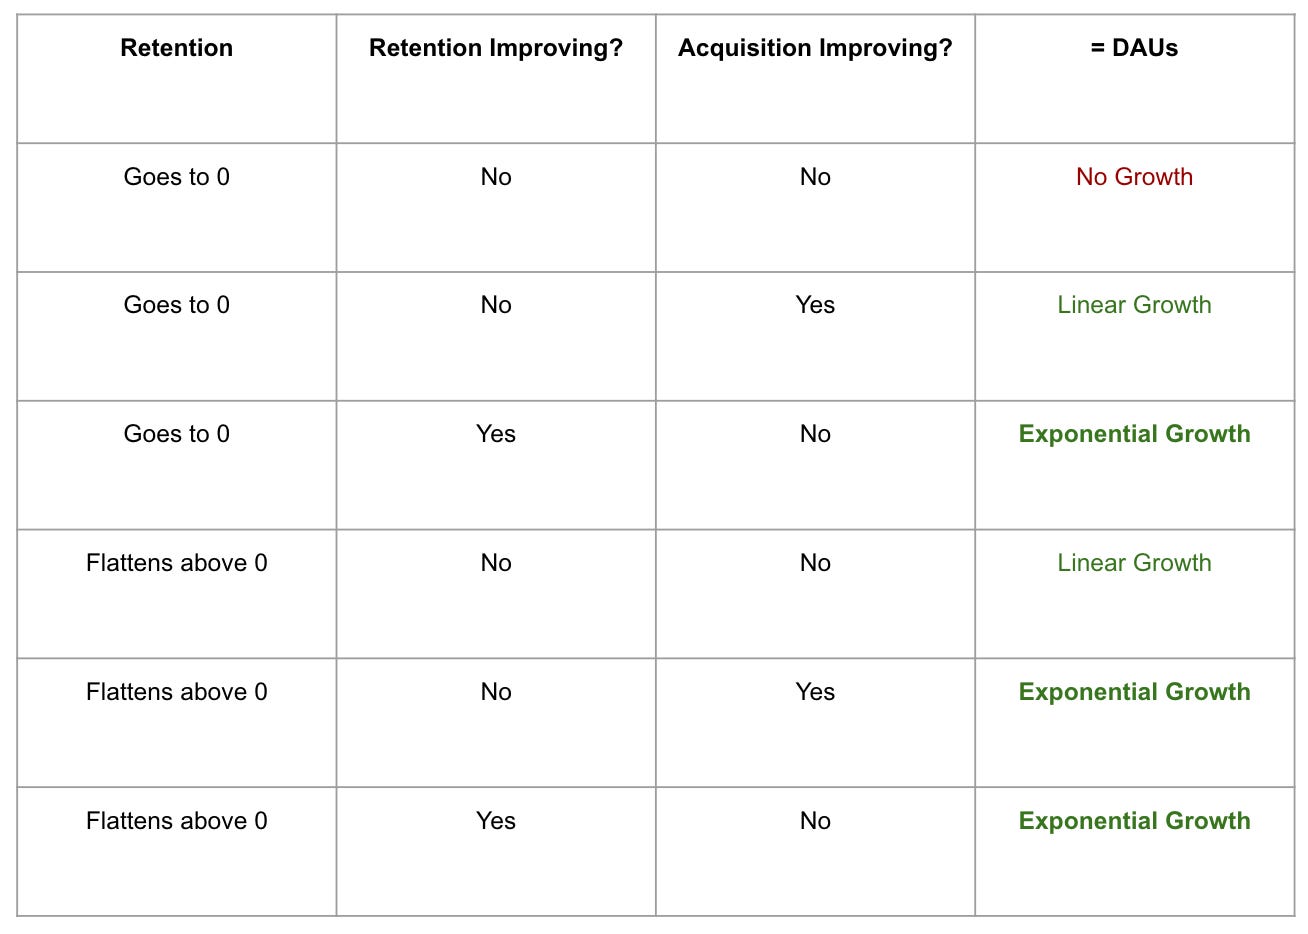
For exponential growth, there needs to be consistent improvement in either acquisition or retention over time.
You can see the general breakdown of how retention and acquisition lead to different growth outcomes below:
Conclusion
In total:
With just a few point values, we can predict an entire retention curve
With a retention curve, we can predict average user tenure, DAUs, and LTV
Flatter retention > higher retention
As an investor, I've used this tool for the past 2 years to ascertain how good a company's retention actually is.
For founders, you can do the same, while also making data-driven forecasts and product decisions.
The Tool!
Try it out! retentionmodels.com


